How Modern Weather Forecasts Are Made, From Satellites to Supercomputers
A daily forecast is the product of millions of observations, physics equations and increasingly machine learning. Here is how the pieces fit together and why forecasts still carry uncertainty.

When a forecast says there is a 60 percent chance of rain tomorrow afternoon, it is easy to treat it as a guess dressed up in numbers. In reality, that single figure sits at the end of one of the largest continuous scientific operations on the planet, involving satellites, ocean buoys, aircraft, balloons and some of the most powerful computers ever built.
Understanding how a forecast is assembled makes it easier to read one well, and to appreciate why they have improved so dramatically over the past few decades.
Step one: measuring the atmosphere
Every forecast begins with observations. Weather satellites in geostationary orbit watch the same part of the Earth continuously, tracking cloud movement and measuring temperature and moisture. Polar-orbiting satellites pass lower overhead, scanning the whole globe in strips and capturing detailed vertical profiles of the atmosphere.
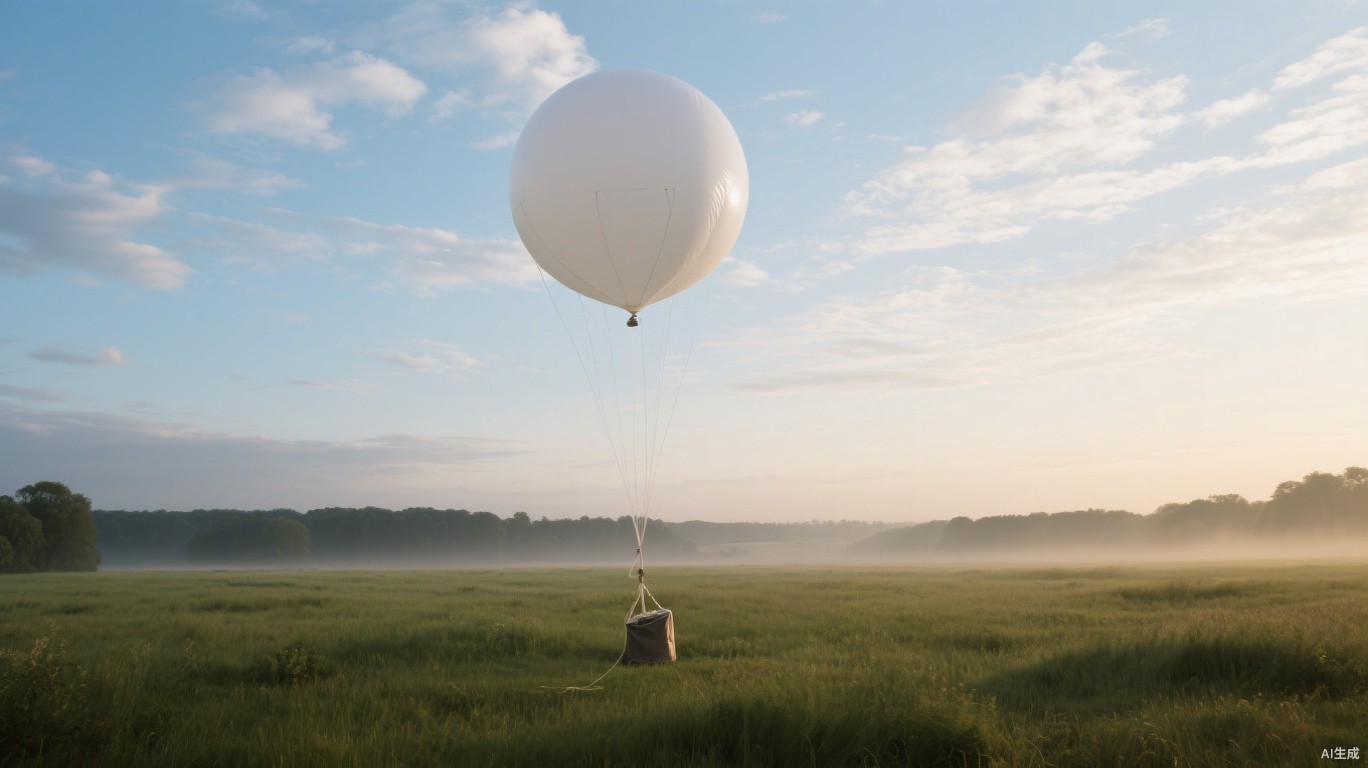
On the ground, thousands of automatic weather stations record temperature, pressure, humidity and wind. At sea, drifting buoys and instruments on commercial ships fill some of the gaps. Twice a day, at stations around the world, meteorologists release weather balloons carrying small instrument packages called radiosondes, which report conditions as they rise through the atmosphere. Commercial aircraft contribute too, transmitting temperature and wind readings during their flights.
Even with all of this, the atmosphere is vastly undersampled. Large parts of the oceans, polar regions and upper atmosphere have relatively few direct measurements, which is one reason satellites have become so important.
Step two: building the starting picture
Raw observations are scattered unevenly in space and time, and each has its own errors. Before a forecast can be run, scientists need a complete, consistent snapshot of the current atmosphere on a three-dimensional grid. This process is called data assimilation.
Assimilation blends the latest observations with a short-range forecast from the previous run, weighting each according to how reliable it is likely to be. The result, called the analysis, is the best available estimate of the state of the atmosphere at a given moment. Forecasters often say that improvements in assimilation have contributed as much to better forecasts as faster computers have.
Step three: running the physics
The analysis is fed into a numerical weather prediction model. At its heart, the model solves equations describing how air moves, how heat is transferred, and how water changes between vapour, liquid and ice. The atmosphere is divided into grid cells, and the equations are stepped forward in time, a few minutes at a time, to project how conditions will evolve.
Some processes, such as individual cloud droplets or small turbulent eddies, are far too small for the grid to capture directly. These are represented through approximations called parameterisations, and refining them is a major area of research.
A forecaster at a national weather service described the challenge in simple terms.
We know the laws that govern the atmosphere very well, but we can never measure its starting state perfectly, and small errors at the beginning grow into big ones later.
Why forecasts are given as probabilities
That growth of small errors is the essence of chaos in weather systems. To handle it, forecasting centres run ensembles: dozens of versions of the same forecast, each starting from slightly different initial conditions or using slightly different model settings. If most ensemble members agree, confidence is high. If they diverge, the forecast is less certain.
This is where probabilities come from. A 60 percent chance of rain generally means that, given the information available, rain is expected at that location in about six out of ten similar situations. It does not mean it will rain for 60 percent of the day or over 60 percent of the area.
The arrival of machine learning
In recent years, machine learning models trained on decades of historical weather data have begun producing global forecasts that rival traditional physics-based models on many measures, and they do so in a fraction of the computing time. Major forecasting centres are now testing and, in some cases, running these systems alongside conventional models.
They are not a replacement for physics just yet. Machine learning models still depend on high-quality analyses built from observations and conventional assimilation, and scientists are cautious about how they handle rare or unprecedented events that are poorly represented in historical records.
For anyone simply checking whether to take an umbrella, a few habits help you get more from everyday forecasts:
- Pay attention to probabilities rather than just the weather icon.
- Expect more reliable detail for the next two or three days than for the following week.
- Check how forecasts change over successive updates, which can reveal growing or shrinking confidence.
- Treat official warnings from national weather services as the authoritative guide during severe weather.
- Remember that local features such as hills, coasts and cities can create conditions a broad forecast may not capture.
A modern five-day forecast is now roughly as accurate as a one-day forecast was a few decades ago. That progress came from better observations, smarter assimilation, faster computers and steady scientific refinement. The uncertainty that remains is not a failure but an honest description of a system that is, by its nature, never fully predictable.